

As we advance into 2024, the field of data visualization continues to evolve rapidly, driven by technological innovations and the increasing need for actionable insights from complex datasets. The demand for more intuitive, interactive, and immersive ways to interpret data is shaping the future of data visualization. Here are some of the emerging trends that are set to dominate this space in 2024.
1. AI-Driven Data Visualization
Artificial Intelligence (AI) is revolutionizing data visualization by automating the creation of visualizations and providing deeper insights. AI-driven tools can automatically generate charts, graphs, and dashboards, making data more accessible to non-experts. These tools can also highlight significant patterns, trends, and anomalies that might be missed by human analysts. For instance, AI algorithms can analyze large datasets to identify correlations and causations, presenting them in an easy-to-understand visual format.
2. Augmented Reality (AR) and Virtual Reality (VR) Integration
AR and VR are breaking new ground in data visualization by offering immersive experiences. These technologies allow users to interact with data in three-dimensional space, providing a more engaging and intuitive understanding of complex datasets. For example, AR can overlay data visualizations onto the physical world, while VR can create fully immersive environments where users can explore data landscapes. This is particularly useful in fields such as healthcare, engineering, and urban planning, where spatial data is crucial.
3. Real-Time Data Visualization
The ability to visualize data in real time is becoming increasingly important, especially in industries like finance, logistics, and telecommunications. Real-time data visualization tools allow organizations to monitor their operations continuously and make swift, informed decisions. Advanced streaming analytics platforms are now capable of processing and visualizing data as it is generated, providing up-to-the-second insights. This trend is powered by advancements in edge computing and 5G technology, which reduce latency and enhance data processing speeds.
4. Natural Language Processing (NLP) Integration
Integrating Natural Language Processing with data visualization tools is making it easier for users to interact with data through conversational interfaces. NLP allows users to ask questions and receive visual responses, making data analysis more intuitive and accessible. This trend is enabling the development of more sophisticated chatbots and virtual assistants that can understand and visualize data in response to user queries. For example, a user could ask, "What were our sales figures last quarter?" and receive an interactive chart as a response.
5. Enhanced Customization and Personalization
Personalization in data visualization is becoming more sophisticated, with tools offering advanced customization options to meet the specific needs of different users. This includes the ability to tailor visualizations based on user roles, preferences, and objectives. For instance, executives might prefer high-level dashboards with key performance indicators, while analysts might need more detailed, drill-down visualizations. Enhanced customization ensures that each user gets the most relevant insights in a format that suits their needs.
6. Collaborative Data Visualization
Collaboration is at the heart of many business processes, and data visualization tools are increasingly incorporating features that support collaborative work. Cloud-based visualization platforms allow multiple users to access, edit, and comment on visualizations in real time, fostering teamwork and collective decision-making. These platforms also offer version control, ensuring that everyone is working with the latest data and visualizations. As remote work continues to be prevalent, the importance of collaborative tools will only grow.
7. Sustainability and Ethical Data Visualization
As organizations become more conscious of their environmental impact, there is a growing emphasis on sustainability in data visualization. This includes optimizing visualizations to reduce energy consumption and carbon footprints, especially in large-scale data centers. Additionally, ethical considerations in data visualization are gaining prominence. This involves ensuring transparency, avoiding misleading representations, and upholding data privacy standards. Tools that prioritize ethical practices are likely to gain traction in 2024.
8. Enhanced Data Storytelling
Data storytelling is evolving to become more compelling and effective. The combination of narrative techniques with data visualization helps convey complex information in a more relatable and understandable way. Advanced tools are now offering features that enable users to create dynamic, interactive stories that guide the audience through data insights step-by-step. This trend emphasizes the importance of context, clarity, and engagement in data communication.
Conclusion
The landscape of data visualization is continuously transforming, driven by technological advancements and the need for more effective data interpretation. In 2024, we can expect to see AI, AR/VR, real-time processing, NLP, and enhanced customization playing significant roles in shaping how we visualize and interact with data. These trends will not only make data more accessible and understandable but also empower organizations to make more informed and timely decisions. As we navigate this dynamic field, staying abreast of these emerging trends will be crucial for leveraging the full potential of data visualization technologies.

Leave a Reply
Related Products
You Might Like Also

How to Make Your Own Signature Scent with DIY Perfume

Perfume is a personal expression of one's style and personality. Instead of relying on commercial fragrances, you can create your own unique scent with just a few simple ingredients. Read More

Discover a few of the best online calculators offered by Calculator-online.net for math, chemistry, statistics, and everyday calculations. Read More

In the ever-evolving world of technology, smartphones have become an integral part of our daily lives. Read More

You can find that image-based text extraction technology has revolutionized the way for handling business data and related information. Read More

Image to text converters are great for quickly getting your handwritten work onto your computer in a text format you can edit Read More
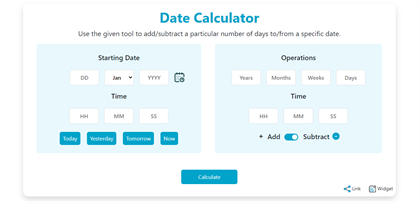
A Review of the Date Calculator and its Features
The date calculator is one of the versatile tools specifically designed to meet the diverse needs of businesses and individuals. Read More


